Largest rectangle in a histogram
- This problem and its underlying concept are integral to numerous real-world applications including image processing, where you might need to find the largest rectangle in a histogram to optimize cropping strategies
- Additionally, such problems are used in statistical data analysis, allowing developers to identify the most significant data ranges in large datasets
- Furthermore, it is also an underlying concept for allocation of screen space in some User Interface (UI) design algorithms for maintaining proper layout and to provide better visual aesthetics
Given an array of integers heights representing the histogram's bar height where the width of each bar is 1 return the area of the largest rectangle in the histogram.
Examples:
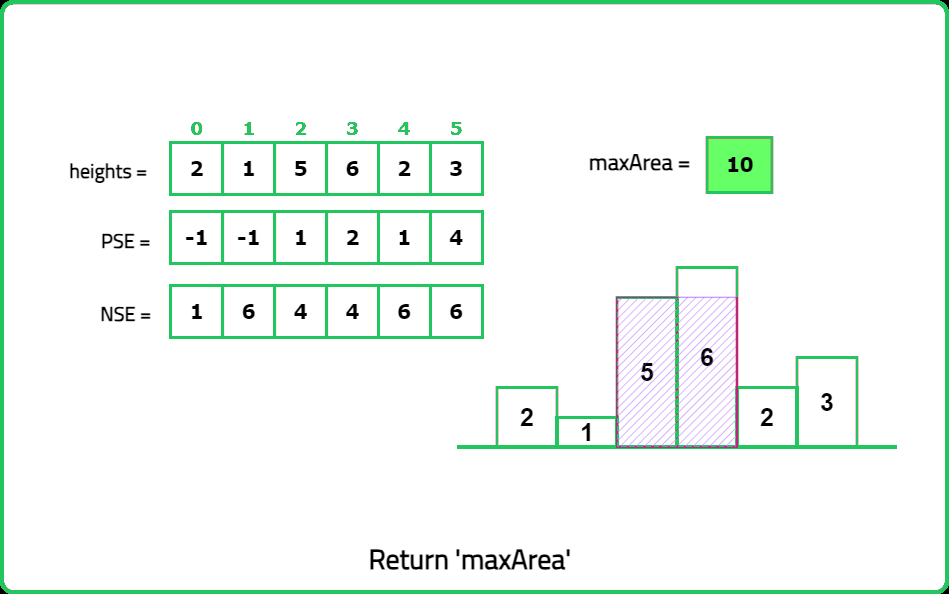
Input: heights = [2, 1, 5, 6, 2, 3]
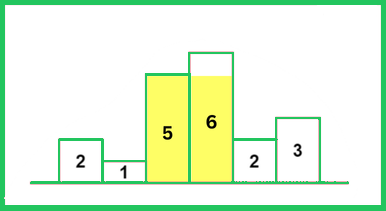
Output: 10
Explanation: The largest rectangle is highlighted, which has an area of 5*2 = 10 units.
Input: heights = [3, 5, 1, 7, 5, 9]
Output: 15
Explanation: The largest rectangle has an area of 5*3 = 15 units.
Input: heights = [2,4]
Constraints
- 1 <= heights.length <= 105
- 0 <= heights[i] <= 104
Hints
- Using Monotonic Stack, Use a monotonic increasing stack to efficiently find the next smaller element on the left and right for each bar. Compute width using nearest smaller elements and calculate the max area.
- Using Divide and Conquer Find the smallest bar, use it as a partition, and recursively compute the max rectangle in left and right segments.
Company Tags
Editorial
Pre requisite: Next greater element
Intuition:
One way to get the maximum rectangle area possible is by considering all the rectangles and then finding the maximum area out of those. To find the area of a rectangle, its height and width must be known. Already given the heights in the question, the only task remaining is to find the width of the rectangle.
The width of a rectangle of current height will depend on the number of rectangles on the left and right having a height greater than or equal to current height.
Understanding:
Consider the following example: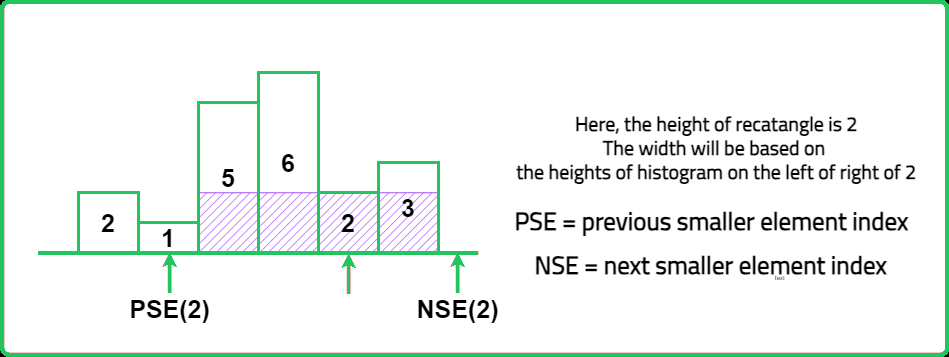
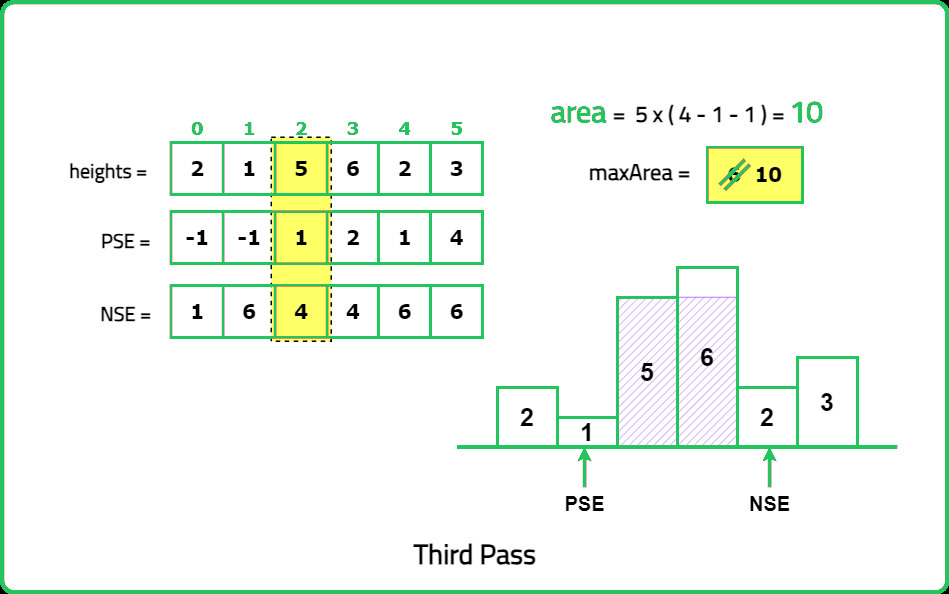
Hence, the width of the rectangle can be found using the concept of Previous/Next Smaller Elements. The formula for the same is:
width = pse[ind] - nse[ind] - 1where, pse[ind] and nse[ind] represent the indices of previous and next smaller element for current index.
Thus the indices of previous and next smaller elements can be precomputed. This will help in finding the area of individual rectangles possible, out of which the maximum can be returned as the answer.
Approach:
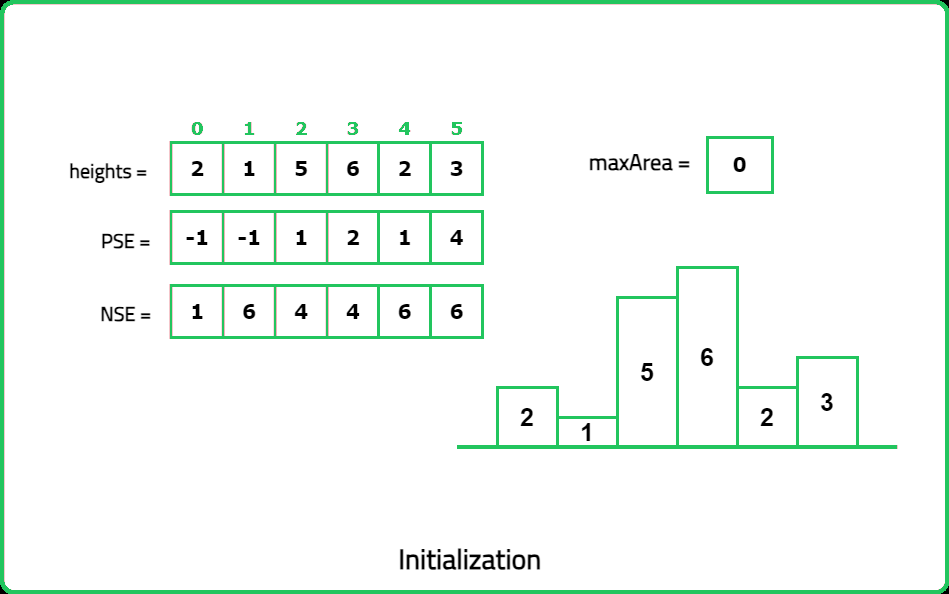
- Find the indices of Next smaller elements and Previous smaller elements using Monotonic stack. For elements having no previous smaller element, use -1 as index. While for elements having no next smaller elements, use the size of array as index.
- Use the precomputed NSE and PSE arrays to determine the width of the rectangle that each bar can form.
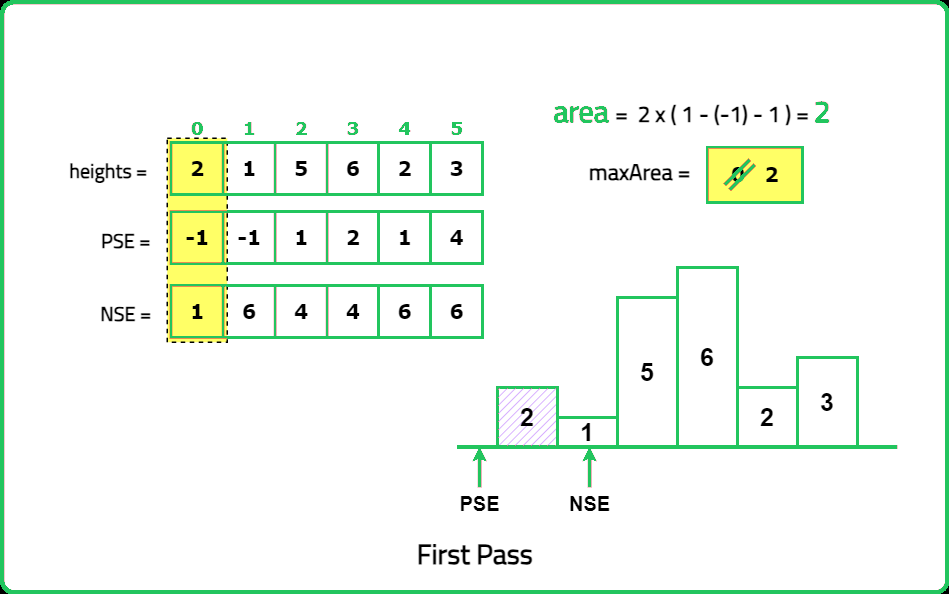
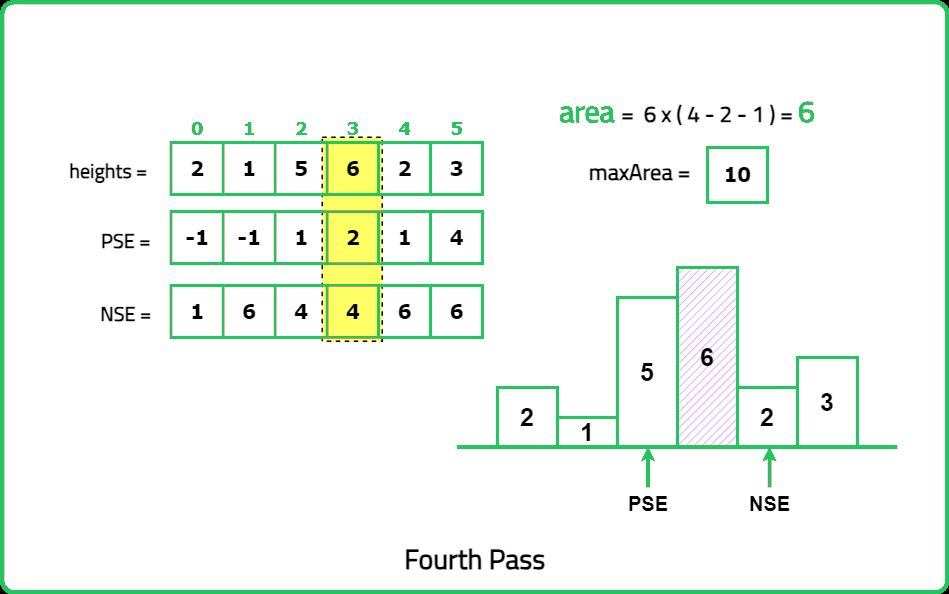
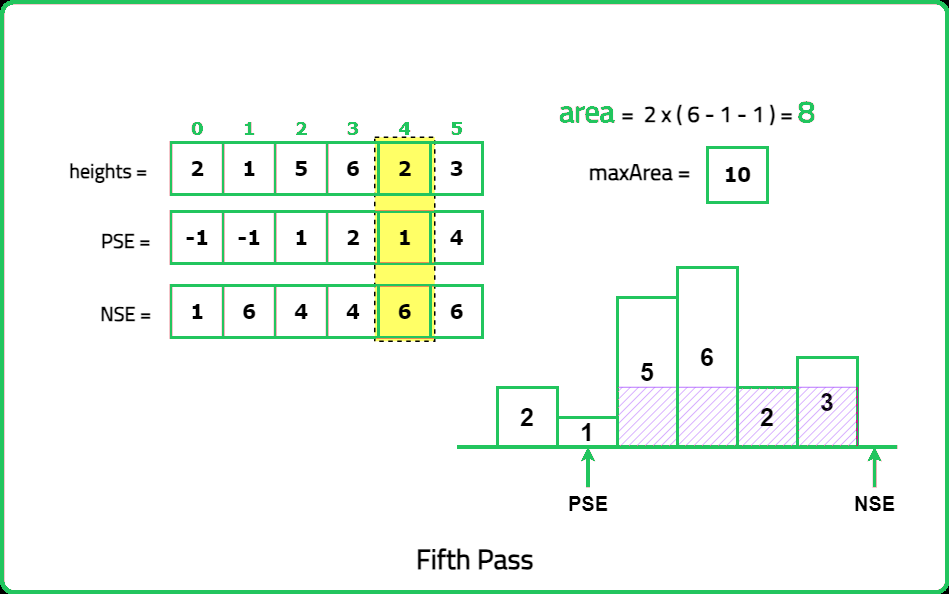
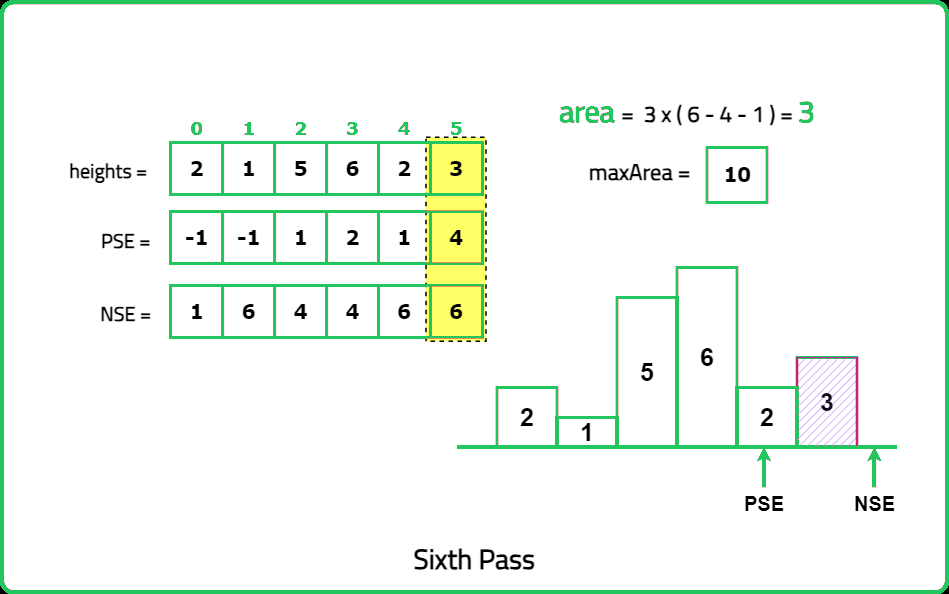
- For each bar, calculate the area using its height and the distance between the NSE and PSE indices.
- Keep track of the maximum area encountered during this process.
Dry Run:

Solution:
#include <bits/stdc++.h>
using namespace std;

class Solution {
private:
    /* Function to find the indices of
    next smaller elements */
    vector<int> findNSE(vector<int> &arr) {

        // Size of array
        int n = arr.size();

        // To store the answer
        vector<int> ans(n);

        // Stack
        stack<int> st;

        // Start traversing from the back
        for(int i = n - 1; i >= 0; i--) {

            // Get the current element
            int currEle = arr[i];

            /* Pop the elements in the stack until
            the stack is not empty and the top
            element is not the smaller element */
            while(!st.empty() && arr[st.top()] >= arr[i]){
                st.pop();
            }

            // Update the answer
            ans[i] = !st.empty() ? st.top() : n;

            /* Push the index of current
            element in the stack */
            st.push(i);
        }

        // Return the answer
        return ans;
    }

    /* Function to find the indices of
    previous smaller elements */
    vector<int> findPSE(vector<int> &arr) {

        // Size of array
        int n = arr.size();

        // To store the answer
        vector<int> ans(n);

        // Stack
        stack<int> st;

        // Traverse on the array
        for(int i=0; i < n; i++) {

            // Get the current element
            int currEle = arr[i];

            /* Pop the elements in the stack until
            the stack is not empty and the top
            elements is not the smaller element */
            while(!st.empty() && arr[st.top()] >= arr[i]){
                st.pop();
            }

            // Update the answer
            ans[i] = !st.empty() ? st.top() : -1;

            /* Push the index of current
            element in the stack */
            st.push(i);
        }

        // Return the answer
        return ans;
    }

public:

    // Function to find the largest rectangle area
    int largestRectangleArea(vector<int> &heights) {

        /* Determine the next and
        previous smaller elements */
        vector<int> nse = findNSE(heights);
        vector<int> pse = findPSE(heights);

        // To store largest area
        int largestArea = 0;

        // To store current area
        int area;

        // Traverse on the array
        for(int i=0; i < heights.size(); i++) {

            // Calculate current area
            area = heights[i] * (nse[i] - pse[i] - 1);

            // Update largest area
            largestArea = max(largestArea, area);
        }

        // Return largest area found
        return largestArea;
    }
};

int main() {
    vector<int> heights = {2, 1, 5, 6, 2, 3};

    /* Creating an instance of
    Solution class */
    Solution sol;

    // Function call to find the largest rectangle area
    int ans = sol.largestRectangleArea(heights);

    cout << "The largest rectangle area is: " << ans;
    return 0;
}import java.util.*;
class Solution {
/* Function to find the indices of
next smaller elements */
private int[] findNSE(int[] arr) {
// Size of array
int n = arr.length;
// To store the answer
int[] ans = new int[n];
// Stack
Stack<Integer> st = new Stack<>();
// Start traversing from the back
for(int i = n - 1; i >= 0; i--) {
// Get the current element
int currEle = arr[i];
/* Pop the elements in the stack until
the stack is not empty and the top
element is not the smaller element */
while(!st.isEmpty() &&
arr[st.peek()] >= arr[i]){
st.pop();
}
// Update the answer
ans[i] = !st.isEmpty() ? st.peek() : n;
/* Push the index of current
element in the stack */
st.push(i);
}
// Return the answer
return ans;
}
/* Function to find the indices of
previous smaller elements */
private int[] findPSE(int[] arr) {
// Size of array
int n = arr.length;
// To store the answer
int[] ans = new int[n];
// Stack
Stack<Integer> st = new Stack<>();
// Traverse on the array
for(int i=0; i < n; i++) {
// Get the current element
int currEle = arr[i];
/* Pop the elements in the stack until
the stack is not empty and the top
elements is not the smaller element */
while(!st.isEmpty() &&
arr[st.peek()] >= arr[i]){
st.pop();
}
// Update the answer
ans[i] = !st.isEmpty() ? st.peek() : -1;
/* Push the index of current
element in the stack */
st.push(i);
}
// Return the answer
return ans;
}
// Function to find the largest rectangle area
public int largestRectangleArea(int[] heights) {
/* Determine the next and
previous smaller elements */
int[] nse = findNSE(heights);
int[] pse = findPSE(heights);
// To store largest area
int largestArea = 0;
// To store current area
int area;
// Traverse on the array
for(int i=0; i < heights.length; i++) {
// Calculate current area
area = heights[i] * (nse[i]-pse[i]-1);
// Update largest area
largestArea = Math.max(largestArea, area);
}
// Return largest area found
return largestArea;
}
public static void main(String[] args) {
int[] heights = {2, 1, 5, 6, 2, 3};
/* Creating an instance of
Solution class */
Solution sol = new Solution();
// Function call to find the largest rectangle area
int ans = sol.largestRectangleArea(heights);
System.out.println("The largest rectangle area is: " + ans);
}
}
class Solution:
    # Function to find the indices of
    # next smaller elements
    def findNSE(self, arr):

        # Size of array
        n = len(arr)

        # To store the answer
        ans = [0] * n

        # Stack
        st = []

        # Start traversing from the back
        for i in range(n - 1, -1, -1):

            # Get the current element
            currEle = arr[i]

            # Pop the elements in the stack until
            # the stack is not empty and the top
            # element is not the smaller element
            while st and arr[st[-1]] >= arr[i]:
                st.pop()

            # Update the answer
            ans[i] = st[-1] if st else n

            # Push the index of current
            # element in the stack
            st.append(i)

        # Return the answer
        return ans

    # Function to find the indices of
    # previous smaller elements
    def findPSE(self, arr):

        # Size of array
        n = len(arr)

        # To store the answer
        ans = [0] * n

        # Stack
        st = []

        # Traverse on the array
        for i in range(n):

            # Get the current element
            currEle = arr[i]

            # Pop the elements in the stack until
            # the stack is not empty and the top
            # elements is not the smaller element
            while st and arr[st[-1]] >= arr[i]:
                st.pop()

            # Update the answer
            ans[i] = st[-1] if st else -1

            # Push the index of current
            # element in the stack
            st.append(i)

        # Return the answer
        return ans

    # Function to find the largest rectangle area
    def largestRectangleArea(self, heights):

        # Determine the next and
        # previous smaller elements
        nse = self.findNSE(heights)
        pse = self.findPSE(heights)

        # To store largest area
        largestArea = 0

        # To store current area
        area = 0

        # Traverse on the array
        for i in range(len(heights)):

            # Calculate current area
            area = heights[i] * (nse[i]-pse[i]-1)

            # Update largest area
            largestArea = max(largestArea, area)

        # Return largest area found
        return largestArea

# Example usage
if __name__ == "__main__":
    heights = [2, 1, 5, 6, 2, 3]

    # Creating an instance of Solution class
    sol = Solution()

    # Function call to find the largest rectangle area
    ans = sol.largestRectangleArea(heights)

    print("The largest rectangle area is:", ans)
class Solution {
    /* Function to find the indices of
    next smaller elements */
    findNSE(arr) {

        // Size of array
        let n = arr.length;

        // To store the answer
        let ans = new Array(n);

        // Stack
        let st = [];

        // Start traversing from the back
        for(let i = n - 1; i >= 0; i--) {

            // Get the current element
            let currEle = arr[i];

            /* Pop the elements in the stack until
            the stack is not empty and the top
            element is not the smaller element */
            while(st.length &&
                  arr[st[st.length - 1]] >= arr[i]){
                st.pop();
            }

            // Update the answer
            ans[i] = st.length ? st[st.length - 1] : n;

            /* Push the index of current
            element in the stack */
            st.push(i);
        }

        // Return the answer
        return ans;
    }

    /* Function to find the indices of
    previous smaller elements */
    findPSE(arr) {

        // Size of array
        let n = arr.length;

        // To store the answer
        let ans = new Array(n);

        // Stack
        let st = [];

        // Traverse on the array
        for(let i = 0; i < n; i++) {

            // Get the current element
            let currEle = arr[i];

            /* Pop the elements in the stack until
            the stack is not empty and the top
            elements is not the smaller element */
            while(st.length &&
                  arr[st[st.length - 1]] >= arr[i]){
                st.pop();
            }

            // Update the answer
            ans[i] = st.length ? st[st.length - 1] : -1;

            /* Push the index of current
            element in the stack */
            st.push(i);
        }

        // Return the answer
        return ans;
    }

    // Function to find the largest rectangle area
    largestRectangleArea(heights) {

        /* Determine the next and
        previous smaller elements */
        let nse = this.findNSE(heights);
        let pse = this.findPSE(heights);

        // To store largest area
        let largestArea = 0;

        // To store current area
        let area = 0;

        // Traverse on the array
        for(let i = 0; i < heights.length; i++) {

            // Calculate current area
            area = heights[i] * (nse[i]-pse[i]-1);

            // Update largest area
            largestArea = Math.max(largestArea, area);
        }

        // Return largest area found
        return largestArea;
    }
}

// Example usage
const heights = [2, 1, 5, 6, 2, 3];

// Creating an instance of Solution class
const sol = new Solution();

// Function call to find the largest rectangle area
const ans = sol.largestRectangleArea(heights);

console.log("The largest rectangle area is:", ans);
Complexity Analysis:
Time Complexity: O(N) (where N is the size of the given array)
- Precomputing PSE and NSE arrays take O(2N) time each.
- Traversing on the given histogram once to find the maximum area takes O(N) time.
Space Complexity: O(N)
- Finding the PSE and NSE arrays uses stack that takes O(N) space each.
- Storing the PSE and NSE arrays take O(N) space each.
Intuition:
In the earlier solution, precomputing the PSE and NSE arrays was contributing to multiple traversals. This can be avoiding by finding the PSE on the go. But the question of finding the NSE still remains.
Understanding:
Consider the following dry run for finding the indices of previous smaller elements using Stack: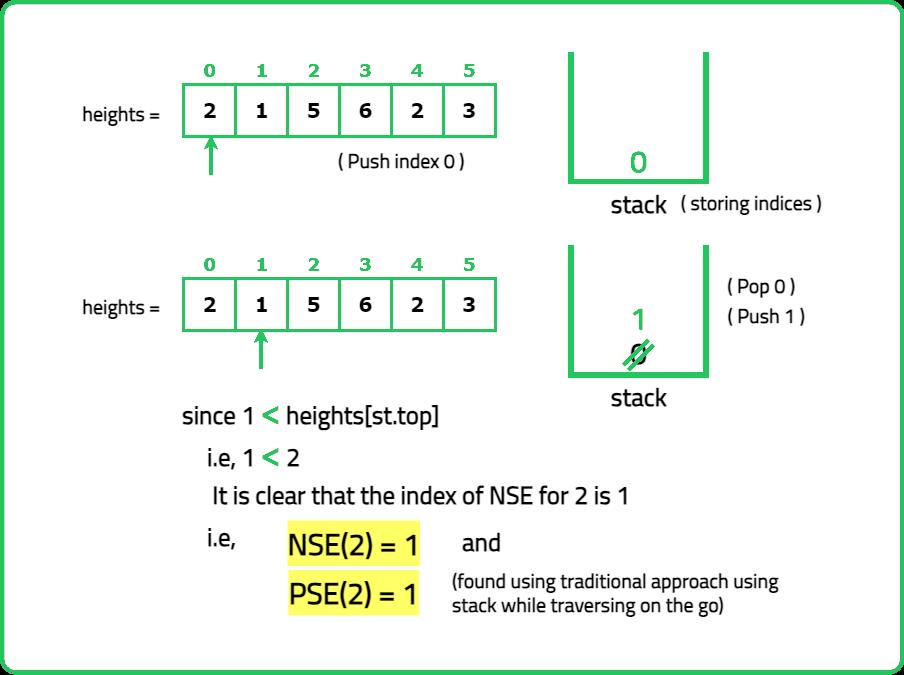
Hence, the index of NSE is known while popping the elements from the stack serving as a backward traversal. Hence, knowing the PSE and NSE, the width of the rectangle can be determined using the formula:
width = pse[ind] - nse[ind] - 1where, pse[ind] and nse[ind] represent the indices of previous and next smaller element for current index.
Handling remaining bars:
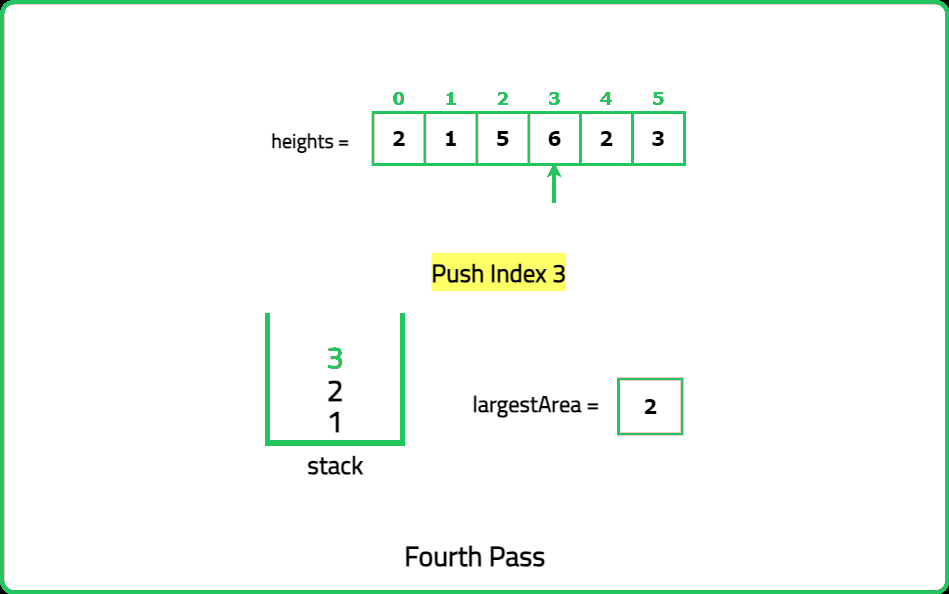
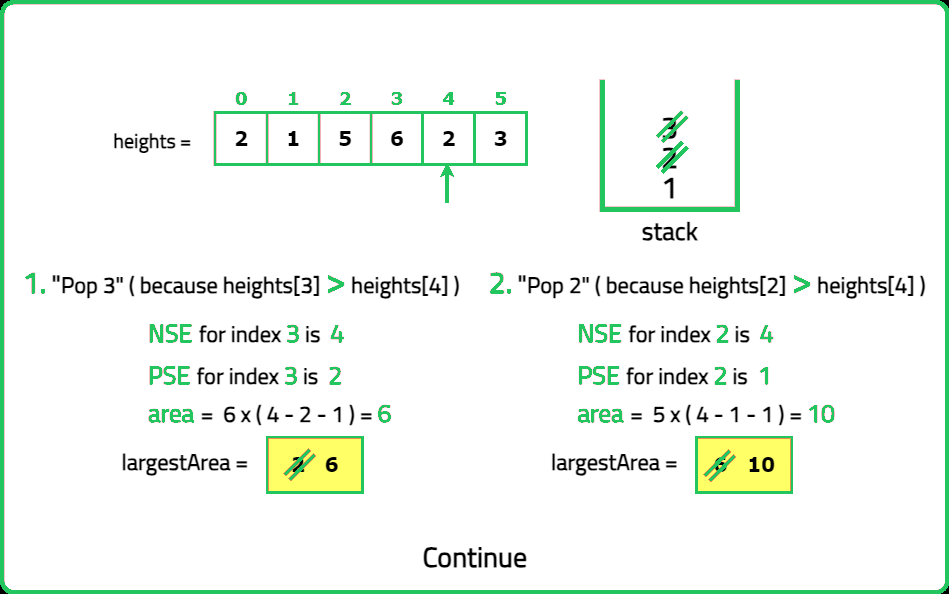
Since the areas of only those rectangles are considered which are popped from the stack, to ensure all the possible heights are considered for areas, all the elements must be popped from the stack even after the traversal of array is complete. For such elements (that remain in stack after traversal), the index of the next smaller element will be set to the size of array as there is no next smaller element.Approach:
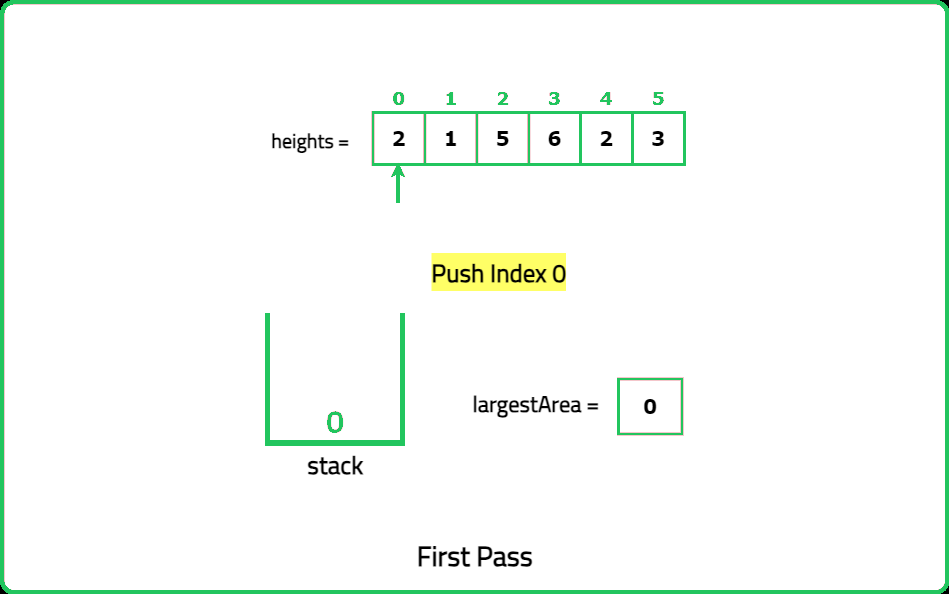
- Initialize an empty stack to store indices of the histogram bars. For each height in the histogram, maintain a stack of indices where the heights are in increasing order.
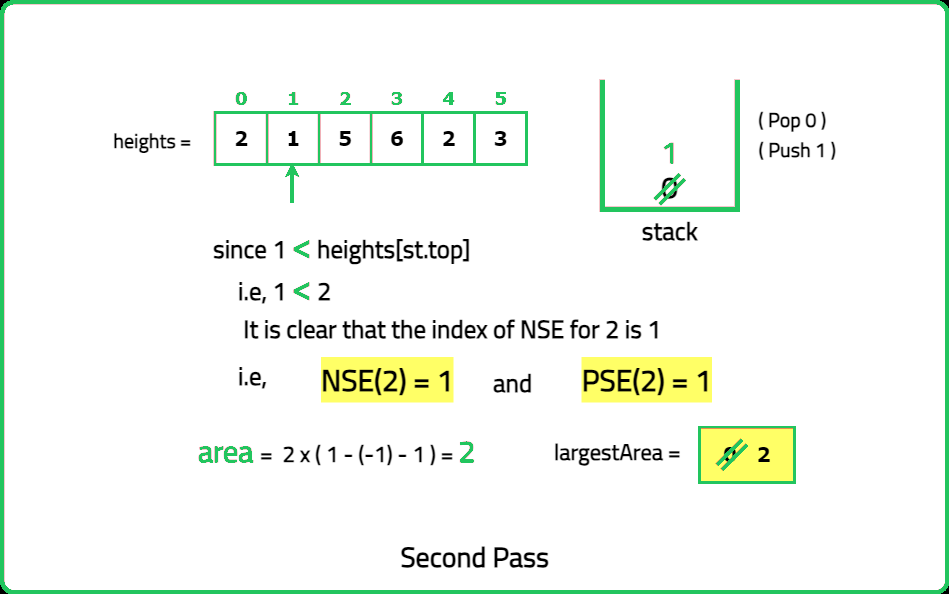
- If the current height is shorter than the height at the top of the stack, it means the rectangle with the height at the top of the stack ends at the current bar.
- For each popped bar from the stack, calculate the width using the current index as the next smaller element (NSE) and the index of the new top of the stack as the previous smaller element (PSE).
- Compute the area and update the maximum area found. After the traversal, the remaining bars in the stack have their NSE as the end of the array.
- Calculate the area for these bars similarly and update the maximum area.
Dry Run:

Solution:
#include <bits/stdc++.h>
using namespace std;

class Solution {
public:

    // Function to find the largest rectangle area
    int largestRectangleArea(vector<int> &heights) {

        int n = heights.size(); // Size of array

        // Stack
        stack<int> st;

        // To store largest area
        int largestArea = 0;

        // To store current area
        int area;

        /* To store the indices of next
        and previous smaller elements */
        int nse, pse;

        // Traverse on the array
        for(int i=0; i < n; i++) {

            /* Pop the elements in the stack until
            the stack is not empty and the top
            elements is not the smaller element */
            while(!st.empty() &&
                  heights[st.top()] >= heights[i]){

                // Get the index of top of stack
                int ind = st.top();
                st.pop();

                /* Update the index of
                previous smaller element */
                pse = st.empty() ? -1 : st.top();

                /* Next smaller element index for
                the popped element is current index */
                nse = i;

                // Calculate the area of the popped element
                area = heights[ind] * (nse-pse-1);

                // Update the maximum area
                largestArea = max(largestArea, area);
            }

            // Push the current index in stack
            st.push(i);
        }

        // For elements that are not popped from stack
        while(!st.empty()) {

            // NSE for such elements is size of array
            nse = n;

            // Get the index of top of stack
            int ind = st.top();
            st.pop();

            // Update the previous smaller element
            pse = st.empty() ? -1 : st.top();

            // Calculate the area of the popped element
            area = heights[ind] * (nse-pse-1);

            // Update the maximum area
            largestArea = max(largestArea, area);
        }

        // Return largest area found
        return largestArea;
    }
};

int main() {
    vector<int> heights = {2, 1, 5, 6, 2, 3};

    /* Creating an instance of
    Solution class */
    Solution sol;

    // Function call to find the largest rectangle area
    int ans = sol.largestRectangleArea(heights);

    cout << "The largest rectangle area is: " << ans;
    return 0;
}import java.util.*;
class Solution {
// Function to find the largest rectangle area
public int largestRectangleArea(int[] heights) {
int n = heights.length; // Size of array
// Stack
Stack<Integer> st = new Stack<>();
// To store largest area
int largestArea = 0;
// To store current area
int area;
/* To store the indices of next
and previous smaller elements */
int nse, pse;
// Traverse on the array
for(int i = 0; i < n; i++) {
/* Pop the elements in the stack until
the stack is not empty and the top
elements is not the smaller element */
while(!st.isEmpty() &&
heights[st.peek()] >= heights[i]) {
// Get the index of top of stack
int ind = st.pop();
/* Update the index of
previous smaller element */
pse = st.isEmpty() ? -1 : st.peek();
/* Next smaller element index for
the popped element is current index */
nse = i;
// Calculate the area of the popped element
area = heights[ind] * (nse - pse - 1);
// Update the maximum area
largestArea = Math.max(largestArea, area);
}
// Push the current index in stack
st.push(i);
}
// For elements that are not popped from stack
while(!st.isEmpty()) {
// NSE for such elements is size of array
nse = n;
// Get the index of top of stack
int ind = st.pop();
// Update the previous smaller element
pse = st.isEmpty() ? -1 : st.peek();
// Calculate the area of the popped element
area = heights[ind] * (nse - pse - 1);
// Update the maximum area
largestArea = Math.max(largestArea, area);
}
// Return largest area found
return largestArea;
}
public static void main(String[] args) {
int[] heights = {2, 1, 5, 6, 2, 3};
/* Creating an instance of
Solution class */
Solution sol = new Solution();
// Function call to find the largest rectangle area
int ans = sol.largestRectangleArea(heights);
System.out.println("The largest rectangle area is: " + ans);
}
}
class Solution:
    # Function to find the largest rectangle area
    def largestRectangleArea(self, heights):
        n = len(heights)  # Size of array

        # Stack
        st = []

        # To store largest area
        largestArea = 0

        # To store current area
        area = 0

        # To store the indices of next
        # and previous smaller elements
        nse = pse = 0

        # Traverse on the array
        for i in range(n):

            # Pop the elements in the stack until
            # the stack is not empty and the top
            # elements is not the smaller element
            while st and heights[st[-1]] >= heights[i]:

                # Get the index of top of stack
                ind = st.pop()

                # Update the index of previous smaller element
                pse = st[-1] if st else -1

                # Next smaller element index for \
                # the popped element is current index
                nse = i

                # Calculate the area of the popped element
                area = heights[ind] * (nse - pse - 1)

                # Update the maximum area
                largestArea = max(largestArea, area)

            # Push the current index in stack
            st.append(i)

        # For elements that are not popped from stack
        while st:

            # NSE for such elements is size of array
            nse = n

            # Get the index of top of stack
            ind = st.pop()

            # Update the previous smaller element
            pse = st[-1] if st else -1

            # Calculate the area of the popped element
            area = heights[ind] * (nse - pse - 1)

            # Update the maximum area
            largestArea = max(largestArea, area)

        # Return largest area found
        return largestArea

# Example usage
if __name__ == "__main__":
    heights = [2, 1, 5, 6, 2, 3]

    # Creating an instance of Solution class
    sol = Solution()

    # Function call to find the largest rectangle area
    ans = sol.largestRectangleArea(heights)

    print("The largest rectangle area is:", ans)
class Solution {
    // Function to find the largest rectangle area
    largestRectangleArea(heights) {
        let n = heights.length; // Size of array

        // Stack
        let st = [];

        // To store largest area
        let largestArea = 0;

        // To store current area
        let area;

        /* To store the indices of next and
        previous smaller elements */
        let nse, pse;

        // Traverse on the array
        for(let i = 0; i < n; i++) {

            /* Pop the elements in the stack until
            the stack is not empty and the top
            elements is not the smaller element */
            while(st.length &&
                  heights[st[st.length - 1]] >= heights[i]) {

                // Get the index of top of stack
                let ind = st.pop();

                /* Update the index of
                previous smaller element */
                pse = st.length ? st[st.length - 1] : -1;

                /* Next smaller element index for
                the popped element is current index */
                nse = i;

                // Calculate the area of the popped element
                area = heights[ind] * (nse - pse - 1);

                // Update the maximum area
                largestArea = Math.max(largestArea, area);
            }

            // Push the current index in stack
            st.push(i);
        }

        // For elements that are not popped from stack
        while(st.length) {

            // NSE for such elements is size of array
            nse = n;

            // Get the index of top of stack
            let ind = st.pop();

            // Update the previous smaller element
            pse = st.length ? st[st.length - 1] : -1;

            // Calculate the area of the popped element
            area = heights[ind] * (nse - pse - 1);

            // Update the maximum area
            largestArea = Math.max(largestArea, area);
        }

        // Return largest area found
        return largestArea;
    }
}

// Example usage
const heights = [2, 1, 5, 6, 2, 3];

// Creating an instance of Solution class
const sol = new Solution();

// Function call to find the largest rectangle area
const ans = sol.largestRectangleArea(heights);

console.log("The largest rectangle area is:", ans);
Complexity Analysis:
Time Complexity: O(N) (where N is the size of the given array)
- Traversing all the elements of array takes O(N) time.
- All the elements are pushed in and popped out from stack once taking O(N) time.
Space Complexity: O(N)
The stack space used to find the previous smaller element during traversal can go upto O(N).
Frequently Occurring Doubts
Q: Why do we need the next smaller elements for computing width?
A: The width of the rectangle for a bar extends from the nearest smaller bar on the left to the nearest smaller bar on the right. Any bar taller than the current bar does not limit its width.
Q: What if all bars have the same height?
A: The largest rectangle is the entire histogram (width = n, height = first bar).
Interview Followup Questions
Q: How would you extend this to a 2D matrix (maximal rectangle in a binary matrix)?
A: Convert each row into a histogram and apply this algorithm row-wise.
Q: Can we find the second-largest rectangle efficiently?
A: Yes, maintain two max areas and track valid segments dynamically.
Notes
Code
10
15
4